Nearly every serious Amazon seller now has access to the same research tools and the same playbooks. In 2026, that means the edge doesn’t come from finding a promising product first — it comes from correctly rejecting the ones that only look promising. This guide walks through a real, repeatable product research process: what to check, in what order, and the outdated shortcuts (like “low review count means low competition”) that quietly lead sellers into bad launches.
Amazon product research follows five stages: generate a broad list of candidates from Best Sellers, Movers & Shakers, and keyword tools; screen each candidate against demand, competition, and margin criteria; validate real search volume with a keyword tool rather than guessing; check for review concentration and IP or category restrictions; then run the numbers through Amazon’s FBA Revenue Calculator before ordering a single sample. A commonly used beginner benchmark is landing in the $15-$85 price range, 200+ units sold monthly, $3,000-$100,000 in monthly category revenue, and a 20%+ net margin after all fees. Products failing more than a couple of these criteria should be rejected — the goal of research is disciplined filtering, not just discovery.
Amazon product research is the process of identifying and evaluating potential products before committing money to inventory — checking real demand, competition, and profit margin instead of guessing. With research tools now widely available and inexpensive, nearly every competitive seller has access to the same data and the same “find a low-competition niche” playbook. That means the differentiator in 2026 isn’t discovering an opportunity first — it’s having the discipline to reject the opportunities that look real on the surface but fail under closer scrutiny.
| Criterion | Common Beginner Benchmark |
|---|---|
| Price | $15–$85 (below often means thin margin; above discourages impulse buys) |
| Monthly unit sales | 200+ units/month for proven, stable demand |
| Monthly category revenue | $3,000–$100,000 (indicates a healthy market without extreme saturation) |
| Weight | Under 2 lbs to minimize shipping and FBA fulfillment fees |
| Net margin | 20%+ after all fees, freight, and product cost |
| Search result saturation | Under 1,000-1,500 results for beginners; 2,000+ often signals an oversaturated niche |
These are commonly cited starting benchmarks, not universal rules — experienced sellers may reasonably bend one or two criteria for a product with a clear strategic advantage.
A relative sales indicator within a category — lower BSR means higher sales. It’s directional, not an exact number, and works best compared across similar products in the same subcategory.
High-volume head-terms are usually already crowded with incumbents. Long-tail variations with lower but real search volume are frequently where a new seller actually has a realistic shot at ranking.
How quickly a product is accumulating new reviews relative to its sales volume — a fast-moving product with sudden review growth signals rising demand or a recent viral moment.
Warn of intellectual property risk or gated categories requiring approval. Skipping this check is one of the fastest ways to lose inventory investment to a takedown before you ever sell a unit.
“Low review count means low competition” has been the default gating rule in Amazon product research for years — and 2026 analysis suggests it deserves to be retired. Review count reflects historical sales volume, not current market concentration. A category where the top 10 products each carry fewer than 300 reviews can still be effectively dominated if two or three of those listings belong to the same brand and combine for the majority of category revenue. Checking who actually owns the top listings — not just how many reviews they’ve accumulated — is now a necessary step, not an optional one.
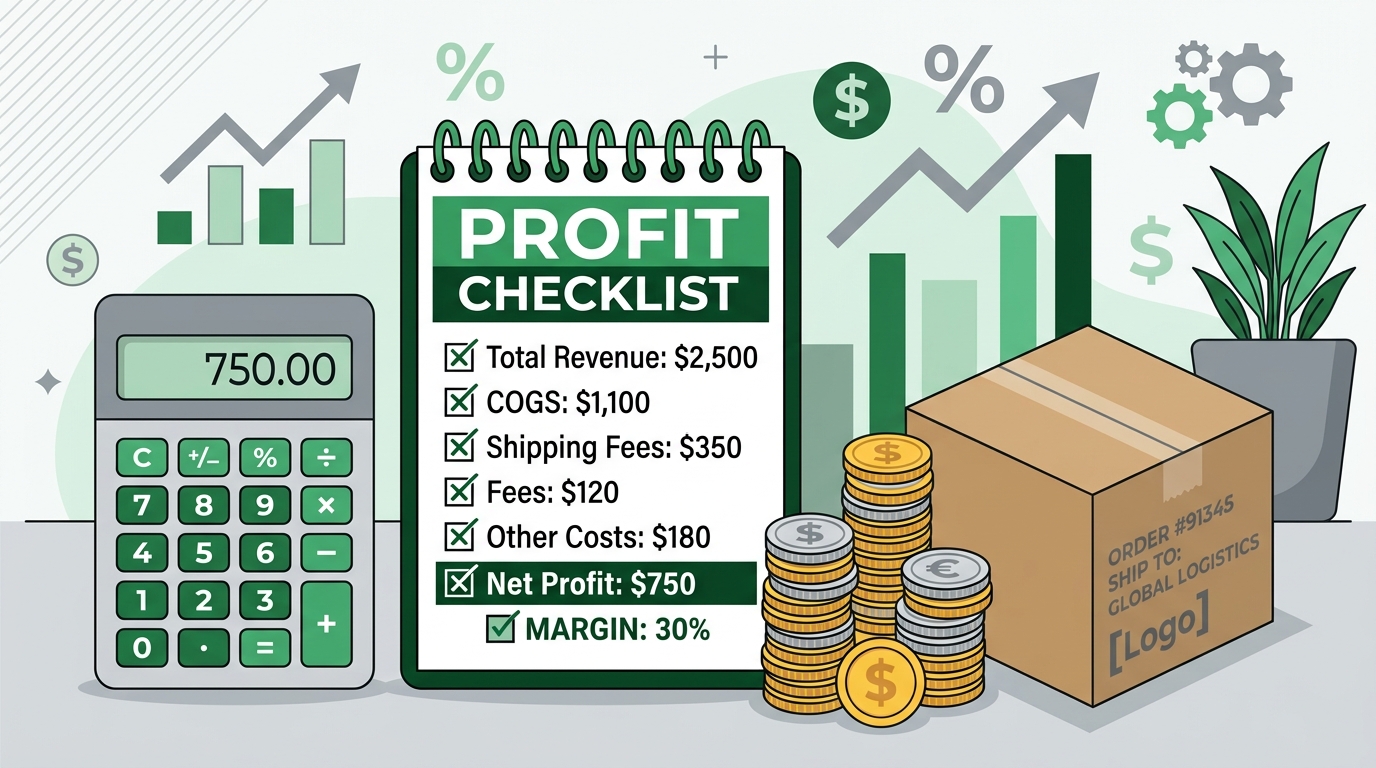
Amazon’s 2026 fee updates added an average of roughly $0.08 per unit across categories, with steeper increases for small standard-size items priced above $50. That shift makes it more important than ever to run final candidates through Amazon’s FBA Revenue Calculator using your actual landed cost — not a rough estimate — before placing a sample order, since a product that cleared 20% margin under last year’s fee structure may not clear it today.
Loving a product category isn’t the same as market size, margin, and competition data supporting it. Validate the economics first — enthusiasm doesn’t cover fixed costs.
Researching for months without ever placing a first order is its own failure mode. Setting a firm research deadline — commonly 30 days from candidate generation to first order — keeps the process moving without sacrificing rigor.
Launching a seasonal product right before its off-season means months of slow sales and mounting storage fees. Timing a launch to lead into seasonal demand, not lag behind it, is part of research, not an afterthought.
Factory photos and spec sheets can look great and still misrepresent the real product. Ordering and personally testing a sample before committing to a full production run remains one of the highest-value, most frequently skipped steps.
Even top research tools carry roughly 85-92% accuracy in high-volume categories, with lower reliability for brand-new or very small niches. Use tool output as directional guidance and validate with multiple sources before committing real money.
High Dreams LLC is a Colorado-based digital growth agency specializing in Amazon store setup, product research, listing optimization, and advertising management — helping sellers validate a product’s real numbers before inventory is ever ordered. The agency has shipped work for 150+ clients worldwide across Amazon, Walmart, Etsy, and eBay.
Candidates screened against demand, competition, and true landed-cost margin before you commit to sourcing.
Real search volume and competitor ownership checked, not just surface-level review counts.
Validated products carried through to a fully optimized listing and launch-phase advertising plan.
Services include e-commerce management across Amazon, Walmart, Etsy, and eBay, plus AI chatbots for customer inquiries and website development for sellers building beyond the marketplace.
Get a free consultation to run your product candidates through a real research and margin check.
Generating a broad candidate list — typically 20-30 products — from Amazon’s Best Sellers, Movers & Shakers, and category browsing, focusing on products ranking #10-50 in their subcategory for proven but not oversaturated demand.
Not on its own. Review count reflects historical sales, not current market concentration — a low-review category can still be dominated if a few listings from the same brand control most of the revenue.
$15-$85 is a commonly used beginner benchmark — below $15 often means thin margins, and above $85 can discourage impulse purchases.
Top tools typically show 85-92% accuracy in high-volume categories, with lower reliability for brand-new products or very small niches. Treat estimates as directional guidance, not exact figures.
A common guideline is around 30 days from candidate generation to placing a first order — long enough to validate properly, short enough to avoid research paralysis.
Sources: AMZScout, “Amazon Product Research: Detailed Guide 2026” · SellerSprite, “Top Selling Items on Amazon and How to Find High Demand Products (2026 Trends)” and “7 Best Amazon Product Research Tools” · Pangolin, “Amazon Product Research: 5 Non-Negotiable Rules for 2026” · NovaData, “Amazon Product Research 2026: The Honest Framework” · Repricer, “7 Best Amazon Product Research Tools for 2026” · SalesDuo, “Amazon Product Research 2026: Step-by-Step Guide for Sellers” · Blue Amber Digital, “Mastering Amazon Product Research” (2026) · AMZ Prep, “Amazon Product Ranking Factors 2026.”